Insights on Our data

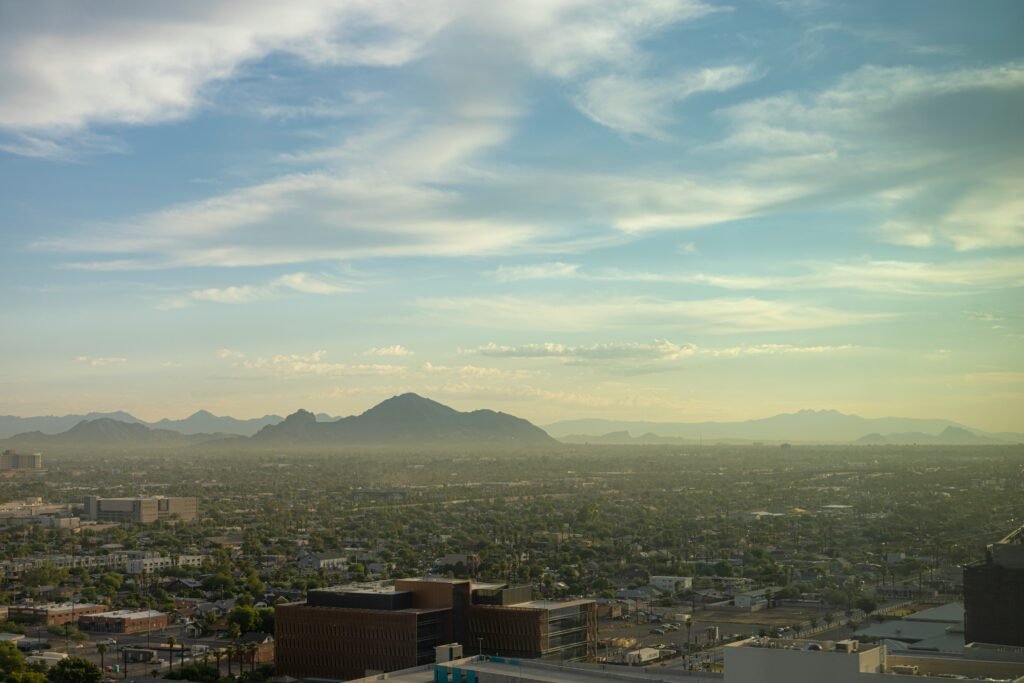
Phoenix, Arizona has some of the worst air quality in the country, especially when it comes to ozone and particulate pollution. The problem has existed for so long that local groups and researchers have created tools to track and understand it. We use some of these resources, along with national data, to gather our own insights and find the best places to set up our Clean Air Gardens where they can make the biggest impact.
Using EPA Data Tools
Understanding air quality is essential to our mission, and the tools we use offer deep insight into environmental conditions across different regions. We analyze data using the EPA Air Data Concentration Plot, which allows us to access official monitoring station records. Through this platform and its related resources, we study long-term trends and pollutant levels to identify patterns, seasonal changes, and areas with consistently poor air quality.
Mapping Real-Time Air Quality
We also use the EPA’s interactive air quality monitor map to visualize monitor locations and collect real-time data. This tool enables us to focus on specific pollutants, such as ozone or particulate matter, and to understand where air quality fails to meet federal standards by analyzing Nonattainment areas. By clicking on individual monitors, we can examine site-specific data that helps us better understand local environmental conditions.
Filling the Gaps with PurpleAir
In addition to EPA data, we utilize PurpleAir, a dense network of real-time air quality sensors, to gain more localized insights. PurpleAir helps us monitor air quality in areas that may not be covered by official EPA stations, offering a fuller picture of pollution levels across both urban and rural spaces. Together, these tools form the foundation of our data-driven approach to addressing air pollution and promoting environmental awareness.
